Initiation of coverage · Ferrari N.V. (RACE.MI)
Ferrari: Where Scarcity Drives Value
Executive summary of an original equity-research report examining Ferrari's scarcity economics, forecast performance, and valuation.
Research and valuation as of 30 June 2026
Explore the valuation
What changes the price?
Model assumptions ·
Adjust the cost of capital and long-term growth to see their effect on Ferrari’s discounted cash flow value. The operating forecast stays fixed.
Original model: WACC 5.84%, terminal growth 2.50%. Interactive controls require JavaScript; the original results and sensitivity table remain available below.
Original DCF assumptions
€327.33DCF value per share
+2.66% versus the €318.85 reference price
- Forecast cash flows
- €14.37bn
- Terminal value
- €43.23bn
Present values. Terminal value accounts for 75.0% of enterprise value.
This is the DCF component. The report’s €325.32 blended target and HOLD recommendation remain dated 30 June 2026.
See the sensitivity table
DCF value per share (€). All 49 scenarios are recalculated from the workbook’s formulas. The outlined cell follows your selected assumptions. Scroll horizontally on small screens.
| WACC / g | 1.75% | 2.00% | 2.25% | 2.50% | 2.75% | 3.00% | 3.25% |
|---|---|---|---|---|---|---|---|
| 5.09% | 345.58 | 367.42 | 393.10 | 423.75 | 460.96 | 507.09 | 565.78 |
| 5.34% | 320.95 | 339.37 | 360.77 | 385.94 | 415.97 | 452.44 | 497.64 |
| 5.59% | 299.54 | 315.24 | 333.28 | 354.25 | 378.92 | 408.36 | 444.10 |
| 5.84% | 280.76 | 294.26 | 309.64 | 327.33 | 347.88 | 372.06 | 400.91 |
| 6.09% | 264.16 | 275.86 | 289.09 | 304.17 | 321.51 | 341.65 | 365.35 |
| 6.34% | 249.37 | 259.59 | 271.06 | 284.03 | 298.81 | 315.80 | 335.55 |
| 6.59% | 236.12 | 245.10 | 255.12 | 266.37 | 279.08 | 293.57 | 310.23 |
Assumptions, calculation & source notes
Each FY2026–35 cash flow is discounted by (1 + WACC)year − 181/365. Terminal value is FY2035 cash flow × (1 + growth) ÷ (WACC − growth), discounted over 10 − 181/365 years. WACC must exceed terminal growth.
The equity bridge applies −€9.679m net debt (31 December 2025) and −€7.849m non-controlling interests to enterprise value, then divides by 175,916,530 shares. All operating forecasts, the equity bridge and share count are held fixed.
Source discrepancy: the workbook’s saved sensitivity centre is €352.65, while its formula recalculates to €327.33, matching the DCF sheet. The explorer recalculates this table instead of reproducing its stale saved results. The downloadable workbook is unchanged.
- Operating forecast
- 'DCF Valuation'!L15:U15 → 'Free Cash Flows'!L18:U18 (FY2026–35; € thousand)
- Sensitivity inputs
- 'DCF Valuation'!F9:F10; sensitivity axes: 'DCF Sensivity Analysis'!C15:C21 and D14:J14
- Valuation-date adjustment
- 'DCF Valuation'!F11: (30 June 2026 − 31 December 2025) / 365
- Equity bridge & shares
- 'DCF Valuation'!F29:F30 (signed, € thousand); shares: F32; share value: F33
- Dated share price
- 'WACC'!G27 (€318.85 as of 30 June 2026)
| Year | Unlevered free cash flow (€m) |
|---|---|
| FY2026 | 1,399.598 |
| FY2027 | 1,522.493 |
| FY2028 | 1,647.807 |
| FY2029 | 1,787.347 |
| FY2030 | 1,907.345 |
| FY2031 | 2,016.241 |
| FY2032 | 2,119.241 |
| FY2033 | 2,231.977 |
| FY2034 | 2,330.403 |
| FY2035 | 2,411.957 |
Investment view
Exceptional franchise quality, but limited margin of safety.
The report initiated coverage with a HOLD recommendation and a €325.32 target price, only 2.03% above the €318.85 reference price. Ferrari's controlled-supply model continued to produce pricing power, strong margins, and cash generation; however, the narrow valuation gap suggested that much of this quality was already reflected in the share price.
Business quality
Growth came from value per car, not more cars.
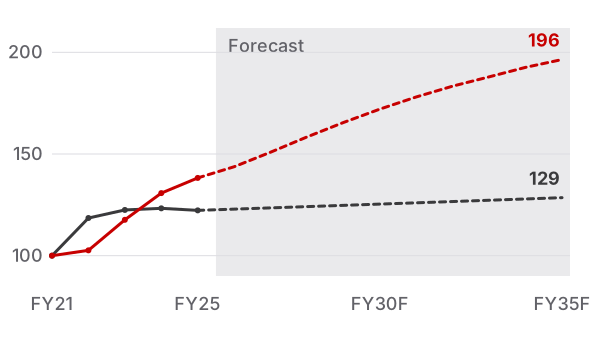
FY2025 shipments declined by 0.8% to 13,640 units, while group revenue increased by 7.0% to €7.15 billion. Cars-and-spares revenue per shipment rose by 5.7% to approximately €440,000, reflecting pricing, model mix, and personalisation rather than volume expansion.
View chart data
| Financial year | Shipments | Cars & spares revenue / shipment (€000) |
|---|---|---|
| FY21 | 11,155.00 | 318.497 |
| FY22 | 13,221.00 | 326.838 |
| FY23 | 13,663.00 | 374.675 |
| FY24 | 13,752.00 | 416.499 |
| FY25 | 13,640.00 | 440.267 |
| FY26F | 13,708.20 | 457.790 |
| FY27F | 13,776.74 | 480.566 |
| FY28F | 13,845.62 | 504.475 |
| FY29F | 13,914.85 | 527.063 |
| FY30F | 13,984.43 | 548.041 |
| FY31F | 14,054.35 | 567.127 |
| FY32F | 14,124.62 | 584.056 |
| FY33F | 14,195.24 | 598.584 |
| FY34F | 14,266.22 | 613.475 |
| FY35F | 14,337.55 | 625.683 |
Historical FY2021-25 · Analyst base case FY2026-35
Customer behaviour reinforced the scarcity thesis: approximately 84% of new cars went to existing owners, and 56% went to clients who already owned more than one Ferrari.
Forecast outlook
Pricing, mix, and personalisation carry the model.
The base case assumed shipment growth of only 0.5% per year. Cars-and-spares revenue growth began at 4.5% in FY2026, peaked at 5.5% in FY2027-28, and faded to 2.5% by FY2035. The model therefore required most growth to come from higher value per vehicle rather than higher production.
What changes the outcome
Catalysts
- Further pricing and personalisation gains.
- Successful launches, including Ferrari Luce deliveries from late 2026.
- Higher dividends and continued share repurchases.
Key risks
- Weaker pricing or mix with limited support from volume.
- Electrification costs or weaker demand for an electric Ferrari.
- Currency, tariffs, regulation, and valuation sensitivity.
Decisions and lessons · Individual research
Separate the business case from the price.
- My contribution
- I built the 24-sheet operating and valuation model and developed the investment thesis, forecast assumptions and original HOLD conclusion.
- Decision
- The business’s pricing power supported the franchise thesis. At the dated reference price, the blended valuation offered only 2.03% upside, so the recommendation remained restrained.
- Lesson
- With roughly 75% of DCF enterprise value in the terminal period, assumptions about discount rates and long-run growth deserve as much attention as the headline price. The explorer makes that sensitivity visible.
- Next check
- A future update would revisit operating assumptions and the dated market inputs, then recalculate and reconcile every valuation output. The existing sensitivity sheet’s stale cache is disclosed in the explorer.
Recommendation
A high-quality business was not automatically an attractive security.
Ferrari's scarcity, loyalty, margins, and cash generation supported the investment case. At the stated price, however, the original valuation offered only modest upside. The report therefore concluded with a HOLD: a positive view of the franchise, but a restrained view of the risk-reward balance.